LESSON 7 INTRODUCTION TO BIO-STATISTICS
Biostatistics is a scientific discipline that is
responsible for the application of statistical analysis to different issues
related to biology. It can be said that biostatistics is an area or a
specialization of statistics, the science dedicated to the quantitative study
of all kinds of variables.
1. MEASURING SCALES
Different
scales are used to measure variables.
Nominal Scale.
Its
purpose is to identify subjects / objects within a distribution, so we can only
establish the relationships of equality / inequality between the subjects /
objects of a distribution. An example is the name of the cities: we can only
differentiate them according to this scale. The number of soccer or basketball
players gives us the same information: it only serves to identify and
differentiate them from other players, we can not establish any kind of order
or gradation based on this number.
Ordinal Scale.
This type of scale is intended to
order the subjects / objects of a distribution according to some
characteristic. It should be noted that the distance between their units is not
uniform. In this way, we can say that A is above B, but not that it is double
or that it is half one another. An example is the order of arrival in a race.
In addition to the attribute of equality / inequality, in this scale we can add
the ordering of its components.
Range of Interval.
In this scale the distance
between the units of measurement is uniform, so that we can say that D is twice
as much as A, for example. Therefore, it allows to perform mathematical
operations, such as addition, subtraction, multiplication or division. The zero
is arbitrary, it does not indicate the absence of attribute. The scale of time
we use can be used as an example: zero is arbitrary, placed at the birth of
Christ, or the scale to measure temperature in degrees centigrade, where zero
is also relative.
Scale of Ratio.
Similar to the interval, with the
only difference that the zero on this scale does indicate the absence of
attribute, is absolute zero. As an example we can indicate the height in
centimeters, or the weight in grams. In both cases 4 is double that 2 (2 + 2 =
4), or 4 is half that 8, for example, because the distance between its units of
measurement is uniform.
1. TYPES OF VARIABLES.
QUALITATIVE
Nominales. There
is no difference of importance.
- Dichotomics: because it has 2 levels or categories (axis: man,
woman). Everything that is answered with yes or no is dichotomous or only with
two variables like the sex, sick or not...
- Policotómicas: More than 2 categories. (Example: single, widow, married,
separated), race, religion...
Orders: They
establish an order, a hierarchy. Satisfaction at work:
Very satisfied. Satisfied. Little
satisfied. Nothing satisfied.
QUANTITATIVES
They are the ones that can be
measured in numerical terms. They are used on interval and reason scales.
- Discrete: They can only
take a finite number of values. The measuring unit can not be fractionated.
Example: No. of children: 1, 2,
3, 4 ...CIGARETTES...
- Continuous: Those that
can be worth any number within a range. The unit of measurement can be
subdivided in infinite form.
· A discrete variable we can not
convert it to continuous, in reverse yes.
The categories must be
constructed with completeness (that
all subjects can be classified at some point in the scale) and exclusivity (they can only be included
in a category)
2. VARIABLES: REPRESENTATION OF DATA.
Frequency tables: Image of data showing frequencies in columns and
categories of variables in rows.
Requirements:
- They are self explanatory.
- They are simple and easy to
understand.
- They have title, brief and
clear.
- Indicate place, date and source
of information.
- It includes the units of
measure in each head.
- Indicate the basis of the
relative measures.
- Make the abbreviations
explicit.
Relative frequency, is a value between 0-1, is studied by dividing the
absolute frequency between the total number of the sample. For example doctors
(658) among the 2343 professionals gives the percentage. Hi = fi / n
The sum of fi = n or the sum of
hi = 1; the sum of the percentages must give 100%
3. CONTINUOUS VARIABLES: REPRESENTATION OF DATA IN A FREQUENCY TABLE.
4. GRAPHIC REPRESENTATION.
· Fast way of communicating
numerical information (frequencies), visually, with bar diagrams
· They are the images of ideas
(bars, histograms, sectors ...).
· Increase written information,
provide visual guidance.
· They do not replace the text,
but as support.
· Basic rules:
Visually clear
Clearly described in footnote and in text.
Graph the conclusions of the study.
Avoid confusing, not overloaded graphics.
MOST FREQUENT LOCAL REACTIONS.
Bar diagram: used to measure a qualitative variable, nominal, and
especially the policotómicas.
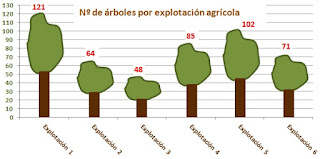
There are variants of the bar
diagram known as pictograms that are used to represent qualitative variables,
it differs from the diagram because the bars are replaced by icons or images
that represent what we are studying.
HISTOGRAMS AND FREQUENCY POLYGONS
Histogram: Same as above, the difference is that it is used for
continuous variables. If the interval amplitude is the same, we will raise
columns attached to the height of the corresponding frequency. If the amplitude
of the interval is different, the area of the column will be proportional to
the frequency represented.
5. GRAPHICS
TRUNK AND LEAF GRAPHICS.
Ways of expressing quantitative
variables, particularly continuous.
GRAPHICS OF SECTORS: They are used to work with QUALITATIVE variables. Preferably for variables with few categories such as dichotomous or maximum 3-4 categories.
GRAPHICS FOR BIDIMENSIONAL DATA: They are quantitative variables.
MULTIDIMENSIONAL GRAPHICS


No hay comentarios:
Publicar un comentario